WATER SOURCE
Water quality lab
Chlorine Test
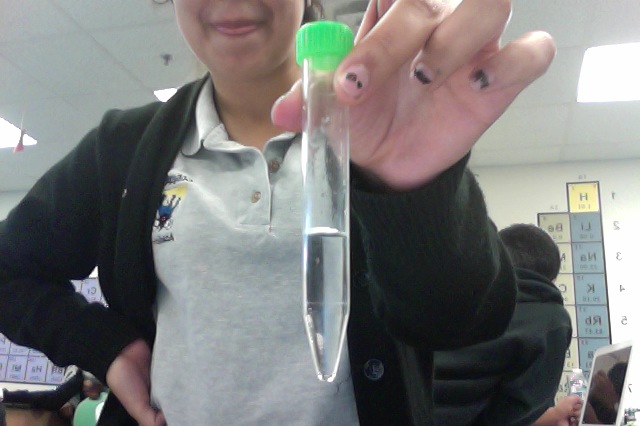
- 1) The water sample tube was filled up with 5 mL of water.
2) Chlorine DPD # 4R was added to the water sample.
3)The tube is caped and mixed until the tablet was dissolved.
4) The color of the sample was compared to the Chlorine color comparsion chart. The results were measured b Parts Per Million (PPM). The results were 3PPM.
Hardness Test
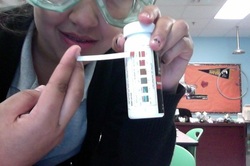
- 1) The tube was filled to 14 mL with tap water.
2) The hardness test strip was dipped into the water sample.
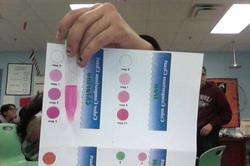
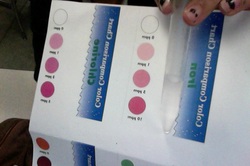
3) The color of the test strip was compared to the hardness color comparsion chart. Results are measured in PPM.
4) The results were 425 PPM, which is very hard.
Iron Test
- 1) Test tube was filled with 5 mL of tap water.
2) One Total Iron TesTab was added to the water sample.
3) Solution was mixed until dissolved.
4) 5 minutes were waited.
6) The color of the sample was compared to the Iron color comparison chart.
7) When the amount of Iron was measured 0 PPM were the results.
Copper Test
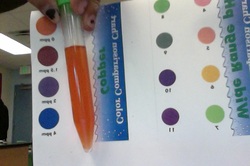
1) The test tube was filled with 10- mL of tap water.
2) One Copper Hr TesTab was added to the tap water sample.
3) The test tube was caped and mixed until dissolved.
4) The color of the sample was compared to the Copper color comparsion chart. Findings are recorded in Parts Per Million.
5) Water sample was disposed after recording results.
6) 0 PPM was found in the water sample/.
pH test
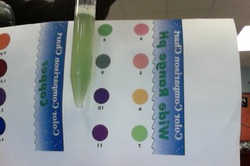
1) Water test tube was filled with 10- mL of tap water.
2) One pH Wide Range TesTab was added to the water sample tube.
3) Test tube was caped and mixed until dissolved.
4) Color of the water sample was compared to the pH color comparison chart.
5) The reacted sample is disposed and the water test tube was rinsed.
6) The pH of the tap water sample is 8 pH, which is basic.
Test Results
Water quality lab data
|
Chlorine
3 PPM |
Hardness
425 PPM |
Iron
0 PPM |
Copper
0 PPM |
pH
8 pH |
Discussion Questions
1) What are the two main types of water pollution?
Point specific pollution and non-point pollution. Point specific pollution is contamination that comes from a specific location. For example, a factory that has a discharge that leads to the water source which will get contaminated. Hardness is a measure of Mg and Ca in H20. Both Ca and Mg may originate from commercial and industrial. waste. Non-Point water pollution does not comes from a specific location. Some examples are runoff of water from city areas, agricultural lamed, or from poor forestry practices. Non-point pollution is harde to find because the pollution is coming from various areas.
Point specific pollution and non-point pollution. Point specific pollution is contamination that comes from a specific location. For example, a factory that has a discharge that leads to the water source which will get contaminated. Hardness is a measure of Mg and Ca in H20. Both Ca and Mg may originate from commercial and industrial. waste. Non-Point water pollution does not comes from a specific location. Some examples are runoff of water from city areas, agricultural lamed, or from poor forestry practices. Non-point pollution is harde to find because the pollution is coming from various areas.
2)List possible sources and effects of each of the pollutants in this activity
The water sample comes from an industry area. The water sample was very hard ( 425 PPM) Hardness is the measure of the amount of calcium and magnesium in water. This hardness originates from commercial and industrial waste. Hard water can cause many problems in industrial and home water systems. One of the main affects of hard water are scaling in pipes and appliances, decrease in effectiveness of soaps and laundry detergents. 180 PPM and above is considered extremely hard.
The water sample comes from an industry area. The water sample was very hard ( 425 PPM) Hardness is the measure of the amount of calcium and magnesium in water. This hardness originates from commercial and industrial waste. Hard water can cause many problems in industrial and home water systems. One of the main affects of hard water are scaling in pipes and appliances, decrease in effectiveness of soaps and laundry detergents. 180 PPM and above is considered extremely hard.
3) Compare and discuss your test results with the accepted values given in the background section of this handout for each factor tested in this activity.
According to the background, the levels of Iron, copper, and pH are normal. Iron is at 0 PPM and iron should not exceed 0.3 PPM which means the level of iron is normal. Copper is at 0 PPM and in general the amount for copper found in drinking water is below 0.3 PPM. The pH is 8 which is basic. The hardness equaled to 425 PPM which is extremely hard according to the water range of 180 PPM and higher is considered extremely hard. The level of chlorine is high because usually chlorine in drinking water supplies is maintained under 0.75 PPM.
4) Compare your values to our classmates' values for each of the pollutants.
The levels of Chlorine ranged from 0,1 and 3 PPM. According to the results we all have a very high level hardness in our water samples. We have the same amount of iron in the tap water sample. The levels of copper are very similar and the levels of copper are normal. For the majority of the class the pH is 7 and two others have a pH of 7.5 and 8.
The levels of Chlorine ranged from 0,1 and 3 PPM. According to the results we all have a very high level hardness in our water samples. We have the same amount of iron in the tap water sample. The levels of copper are very similar and the levels of copper are normal. For the majority of the class the pH is 7 and two others have a pH of 7.5 and 8.
5) What can be done to help minimize the amount of each pollutant in your local tap water?
In order to minimize the amount each pollutant in our tap water we can use special water filters in sinks. This can make it safer for the water to be consumed.
6) Polluted or non- polluted
I would consider my water sample semi-polluted because it has a high level of chlorine and hardness. For iron , copper ,and pH the levels are normal
